Managing layers
The Queensland Globe provides easy access to hundreds of data layers for you to incorporate within a map.
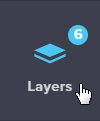
To view the layers panel, select the Layers icon from the sidebar.
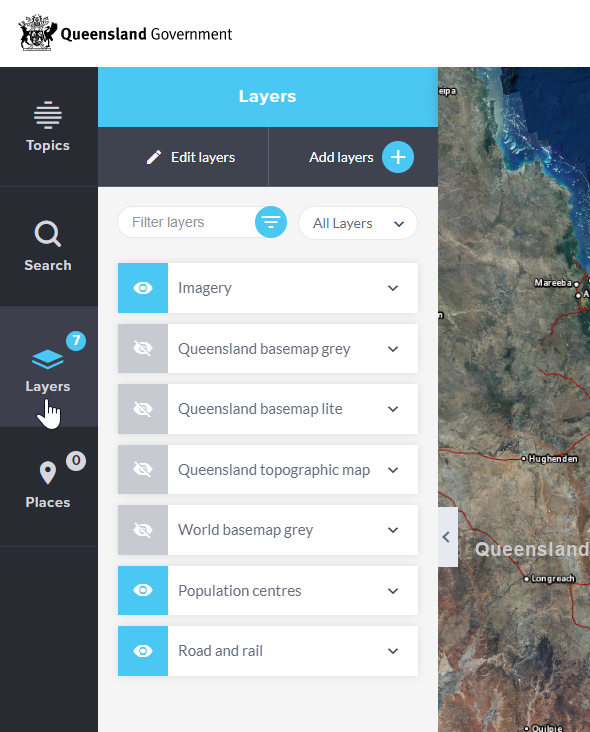
The layers from the default topic are included in the initial map view. You can replace or add to these layers using the following options:
- Select Add layers to add layers from the table of contents
- Launch a Topic to add a group of layers
- Include your own data files, or link to external webservices via the Add My Data tool
- Add georeferenced imagery layers via the Past imagery tool
Add layers
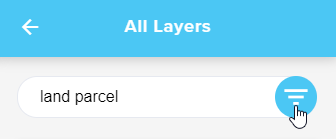
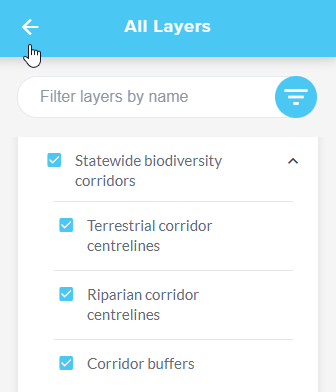
To add a layer from the table of contents view, select Add layers.

Filter layers by name - Enter a portion of a layer name and select the filter list icon to return all available layers, groups and sub-groups that contain that term or phrase.
Select the check box to add a layer to the map.

Alternatively, you can expand a category and select the checkbox to add the layer to the map.
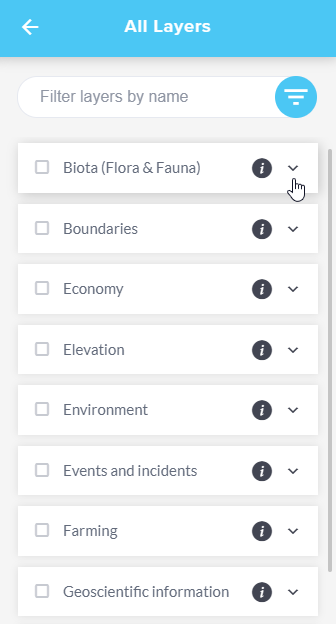
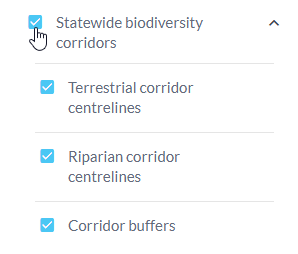
If a chevron icon is visible to the right of the layer name this indicates it is a heading that contains multiple sub-layers.
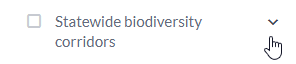
Selecting the chevron icon will display the sub-layers, allowing them to be added to your map independently.
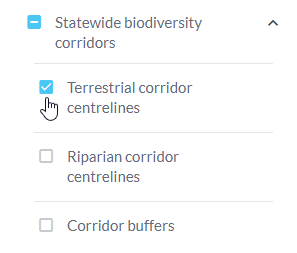
Selecting the checkbox for the heading will add all of the sub-layers to your map.
Select the back arrow (top left of the panel) to return to the Layers panel to show the active layers currently in your map.
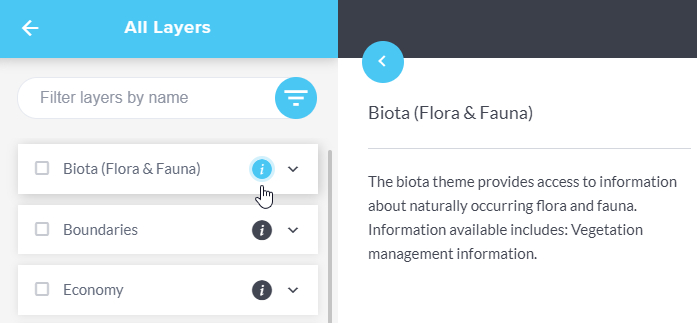
More information for each category can be accessed by selecting the info icon.
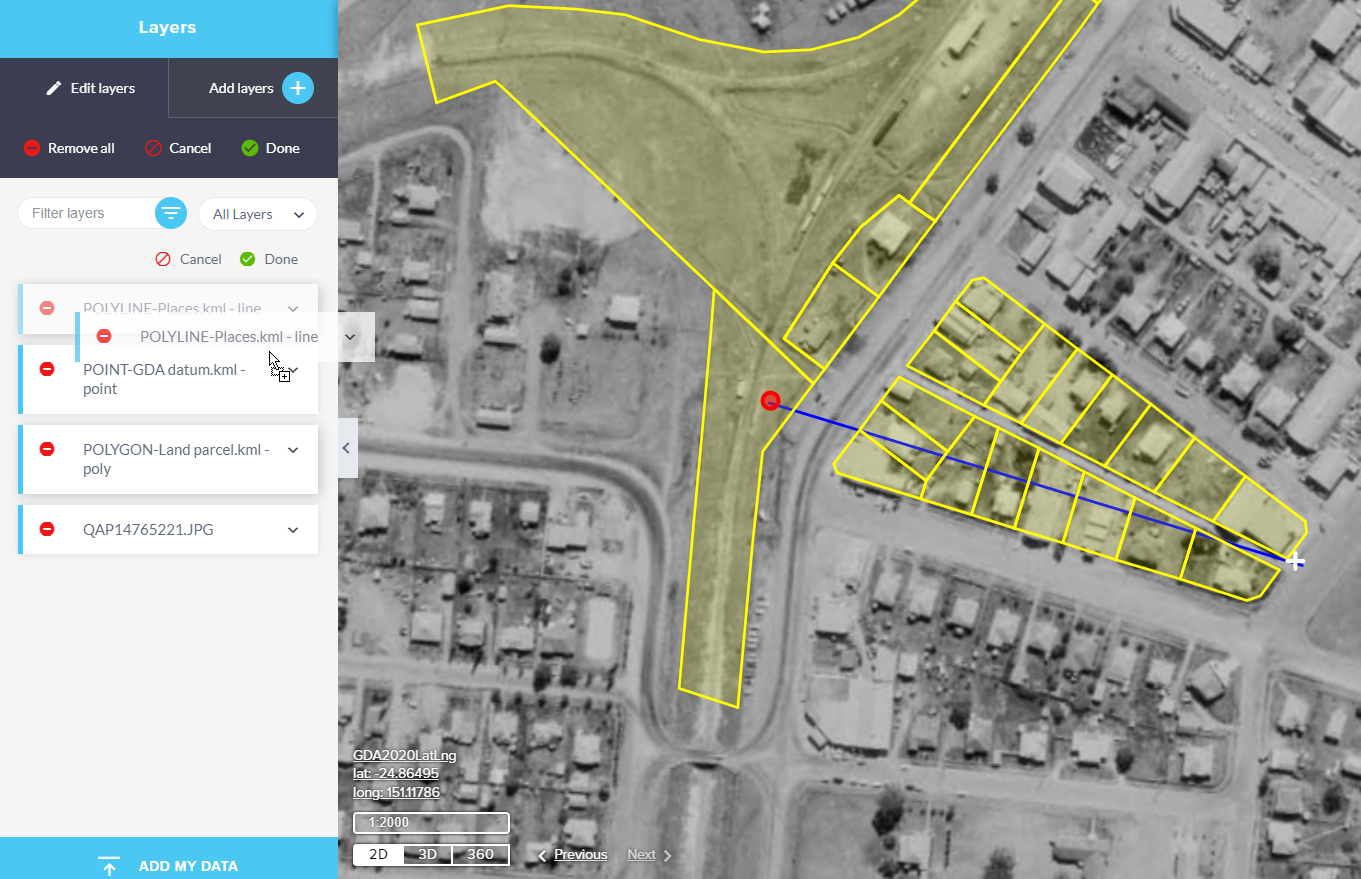
Remove layers
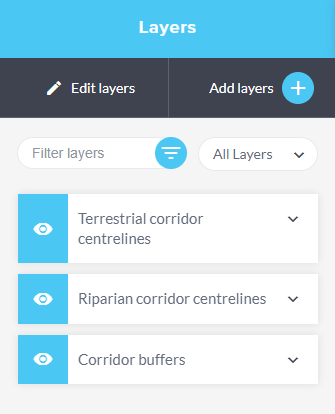
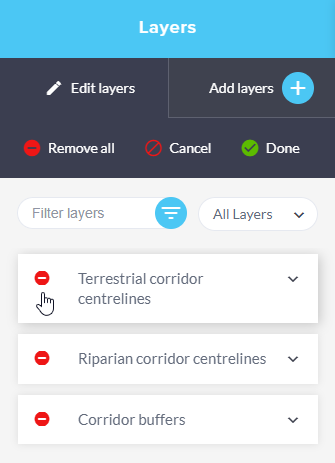
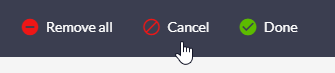
To remove one or more layers from your map, open the Layers panel and select Edit layers.
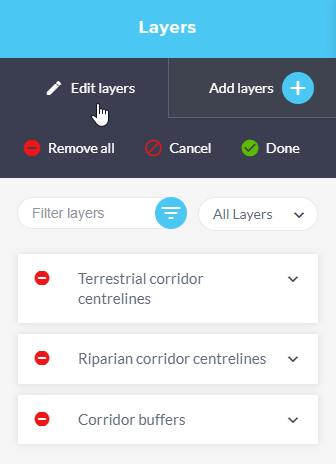
Click the red icon next to all layers or groups you wish to remove.
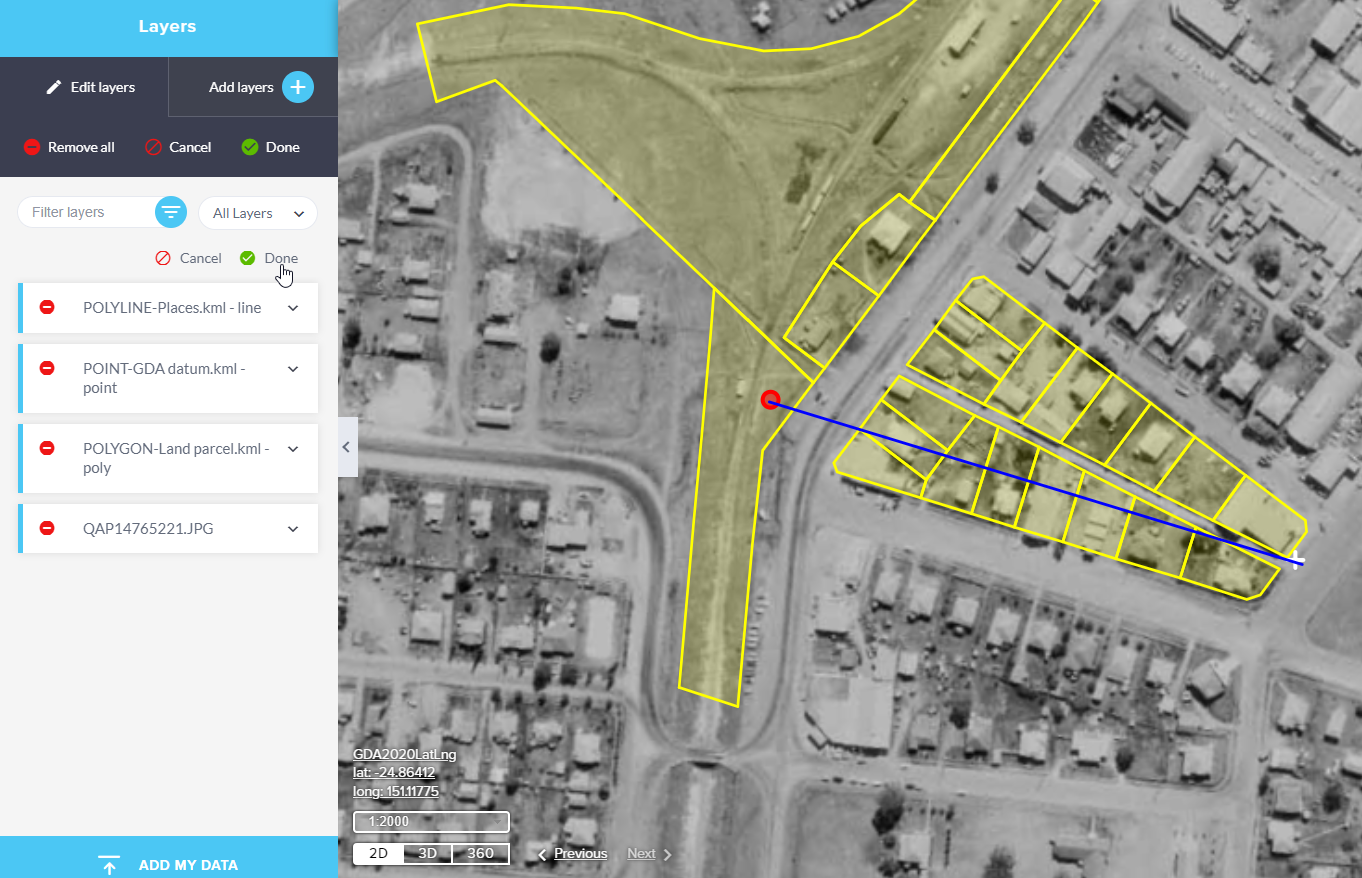
Or select Remove all to remove all layers from the map.
![]()
Select Done to accept the changes.
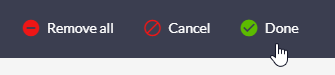
The Cancel button reverts any changes made to the layers since the last time the Done button was selected.
Alternatively, layers can be removed by deselecting the checkbox in the table of contents.
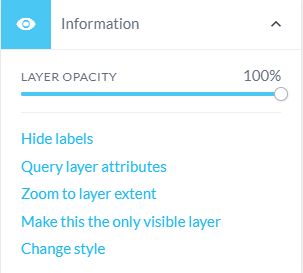
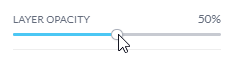
Layer Opacity
Expand the layer details by clicking on the layer name or the arrow next to it. This will reveal additional options and settings for the layer.
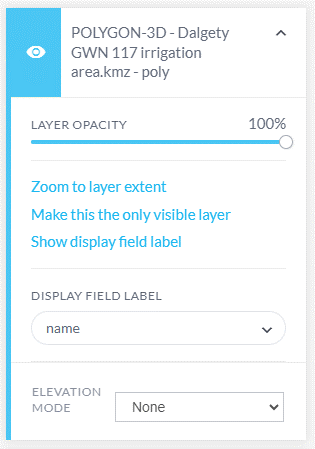
Once the layer details are expanded, locate the Layer Opacity slider within the options.
Adjust the slider to change the opacity of the layer. Moving it to the left decreases opacity (making the layer more see-through), while moving it to the right increases opacity (making the layer less see-through).
As you adjust the opacity, you'll see the changes reflected on the map immediately, allowing you to find the best setting for your needs.
Layer opacity can be applied to layers added via the Layer Panel, user-added data files or services and imagery layers added via the past imagery tool.
Layer opacity settings will be applied at the service level, e.g. If you add a service with a number of layers. When you change the layer opacity of one of those layers in the Layers panel, the same setting is applied to all layers from that service.
Layer opacity changes can be saved and shared in maps and are reflected in print products. The same applies to the 'Fill opacity' of places.
- Overlaying Multiple Layers: Adjust the opacity transparency for each layer to better compare data without losing crucial details.
- Contextual Analysis: Reducing the opacity (increasing transparency) of an imported layer allows the underlying map or other layers to be more visible, providing additional context.
- Highlighting Important Data: : Increase the opacity (reducing transparency) for layers that contain critical information to make them stand out.
View metadata
To access the metadata link for an added layer, expand the layer to view the available options and select Metadata.
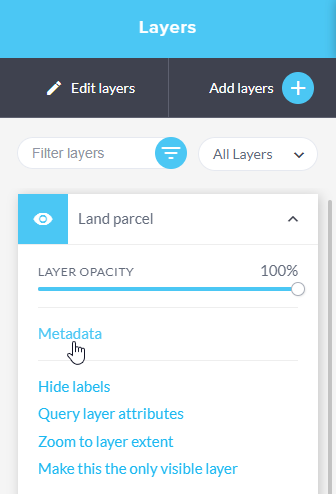
This will open the relevant website in a new browser tab.
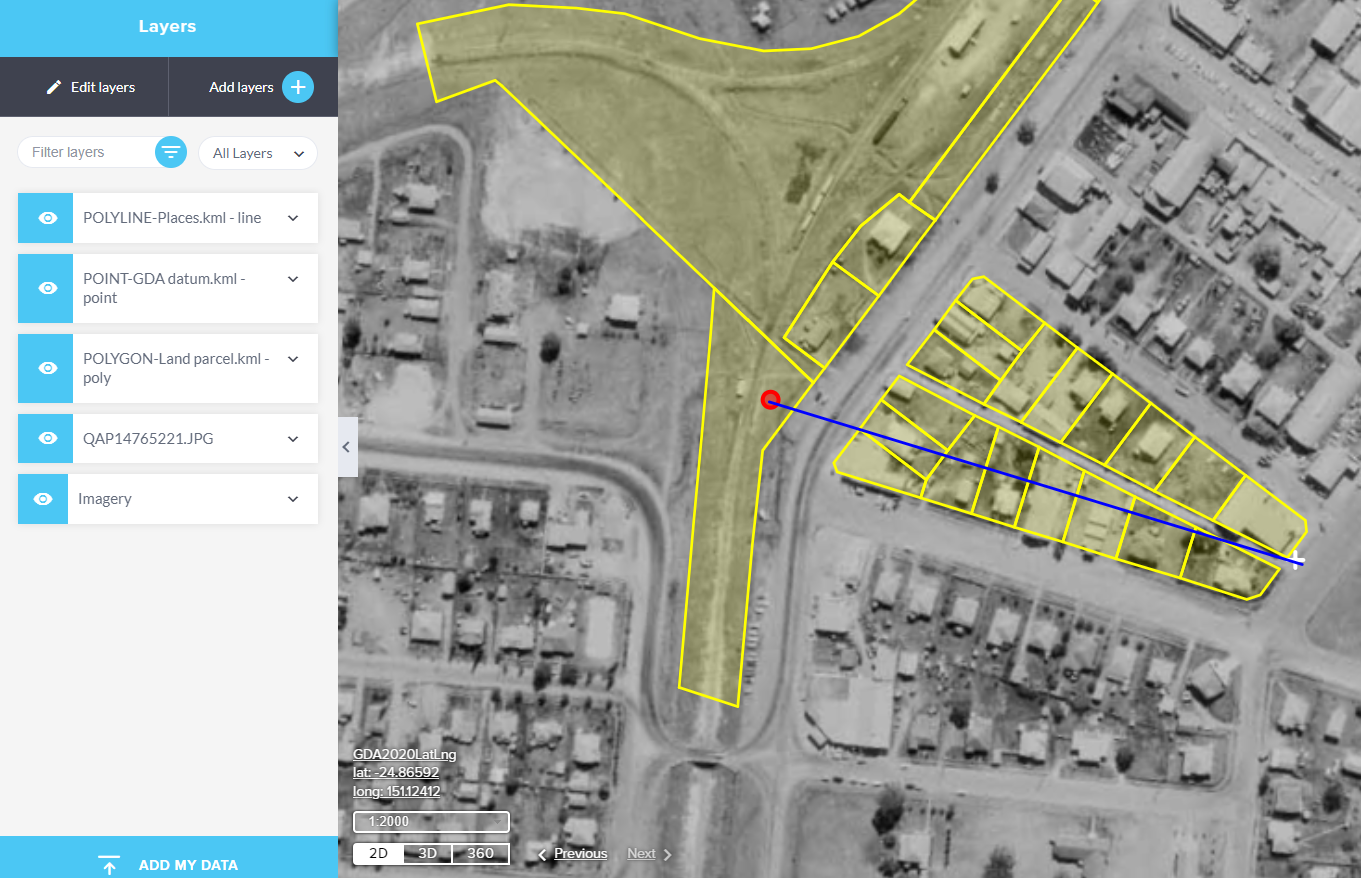
Layer visibility
| Visibility | Description |
|---|---|
| Visible option is selected, the layer is visible in the current map extent. | |
| Hidden option is selected. This will turn the layer off on the map without having to remove it. | |
 |
Visible option is selected but the layer is invisible at the current scale. |
 |
Sets this layer as the only visible layer. |
 |
Zooms in to an extent where the data is visible. This option is available for layers that are visible or hidden. |
 |
Displays all layers in the layer panel. |
 |
Lists all of the layers in the layer panel that are set as visible. |
 |
Lists all of the layers in the layer panel that are set as hidden. |
 |
Lists all of the layers in the layer panel that are active. |
 |
Lists all of the layers in the layer panel that are inactive. |
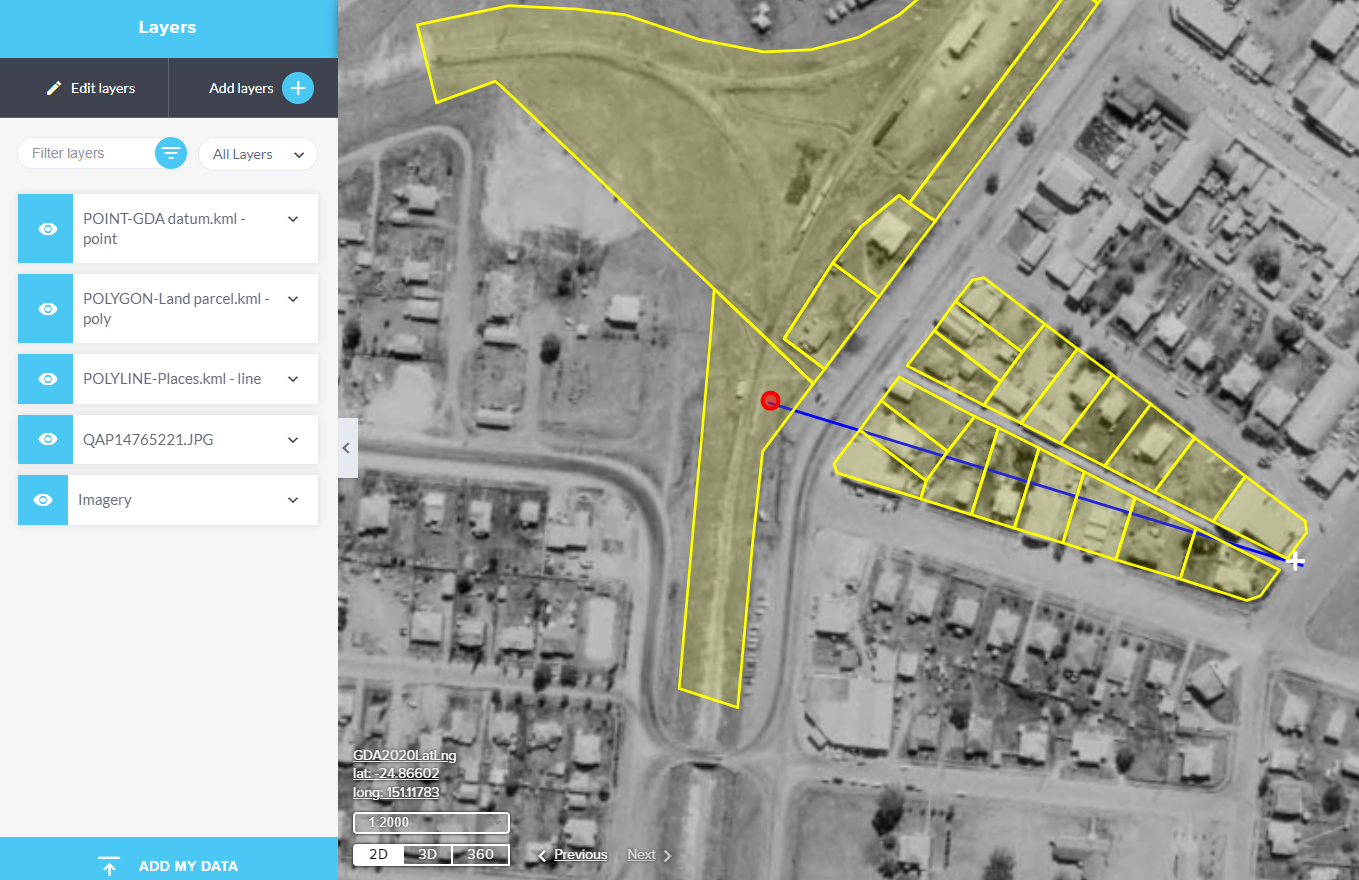
 |
List all layers that have been added via the Add My Data tool. |
 |
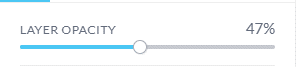
Move the point along the layer opacity slider to adjust the opacity setting. |
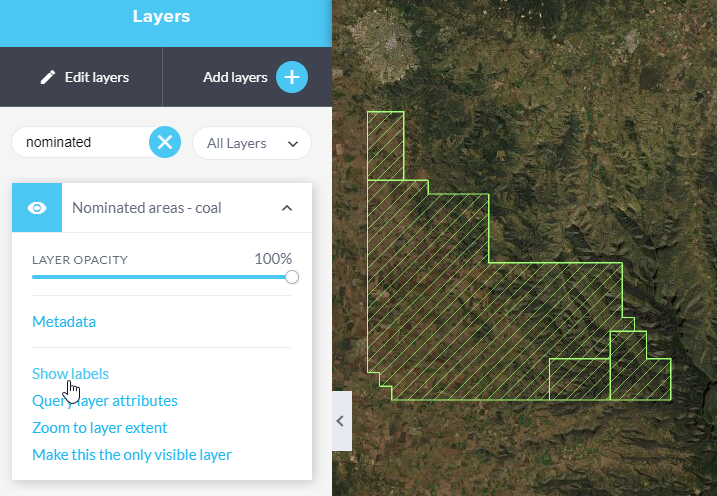
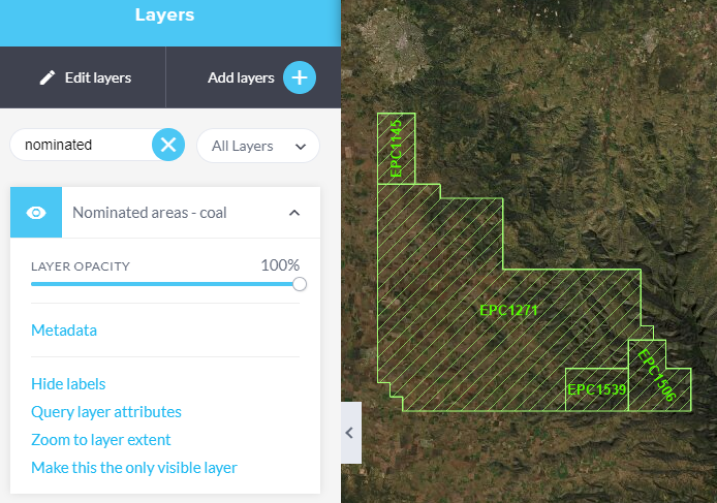
Turn layer labels on and off
Labels can be shown or hidden for all layers that contain labelling. This also includes layers added via the Add My Data tool, such as shape files and map or feature services.
Select the Layers button to open the layers panel.
Navigate through the list to your required layer, and click on the arrow next to it to expand the options for that layer.
![]()
For all layers except shp, csv, kml and json, select Show labels or Hide labels as needed.
For added data files (shp, csv, kml and json) first choose your display field label, then click Show display field label.
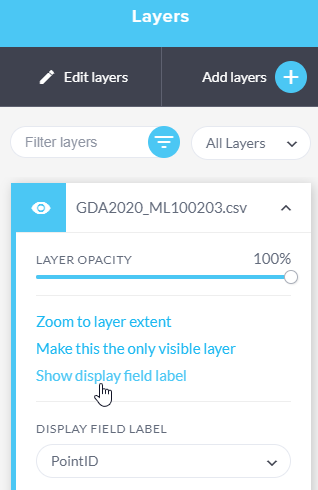
Selecting Hide display field label option will hide the labels in the map view.
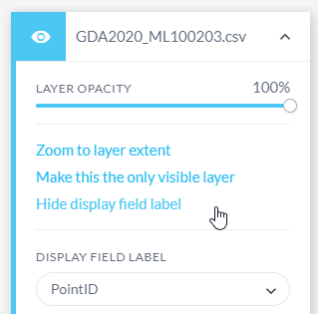
The DISPLAY FIELD LABEL dropdown menu provides a list of the available fields that can be used to generate the label.
Change style
The Change style tool has the following functionality:
- Editing layer symbology: Users can edit the appearance of feature and map service layers using this tool. This includes options such as modifying fill colours, stroke (outline) colours, adjusting fill opacity, and other visual properties. This feature allows users to customize how the geographic data is displayed on the map.
- Availability varies: The availability of this option is not universal across all layers. Please check the layer details to see if this tool is available for a particular layer. If the tool is available, it can be used to adjust the layer's visual properties. If the layer does not support this tool, it will not appear as an available option.
- Retention of style settings: When users make changes to the style of a layer and then save the layer within a map, the new style settings are retained. This means that the customized appearance of the layer will be saved with the map, and these changes will be visible whenever the map is opened again.
To modify the appearance of a layer, follow these steps:
- Expand to view the layer details and select Change style.
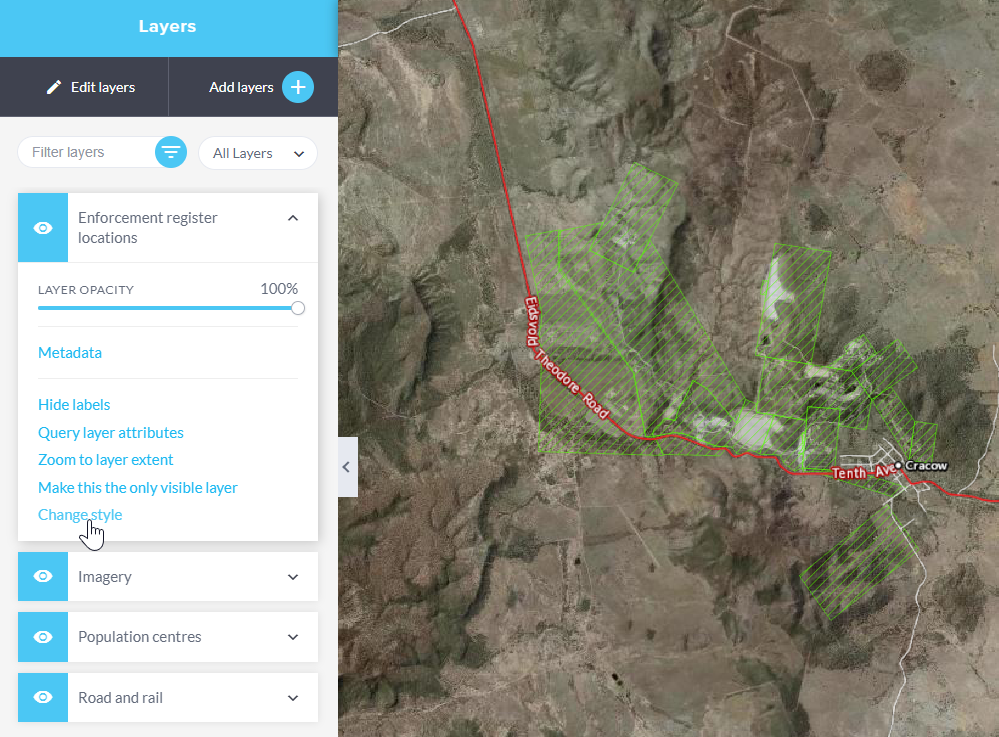
- Adjust the symbology for the layer, as required.
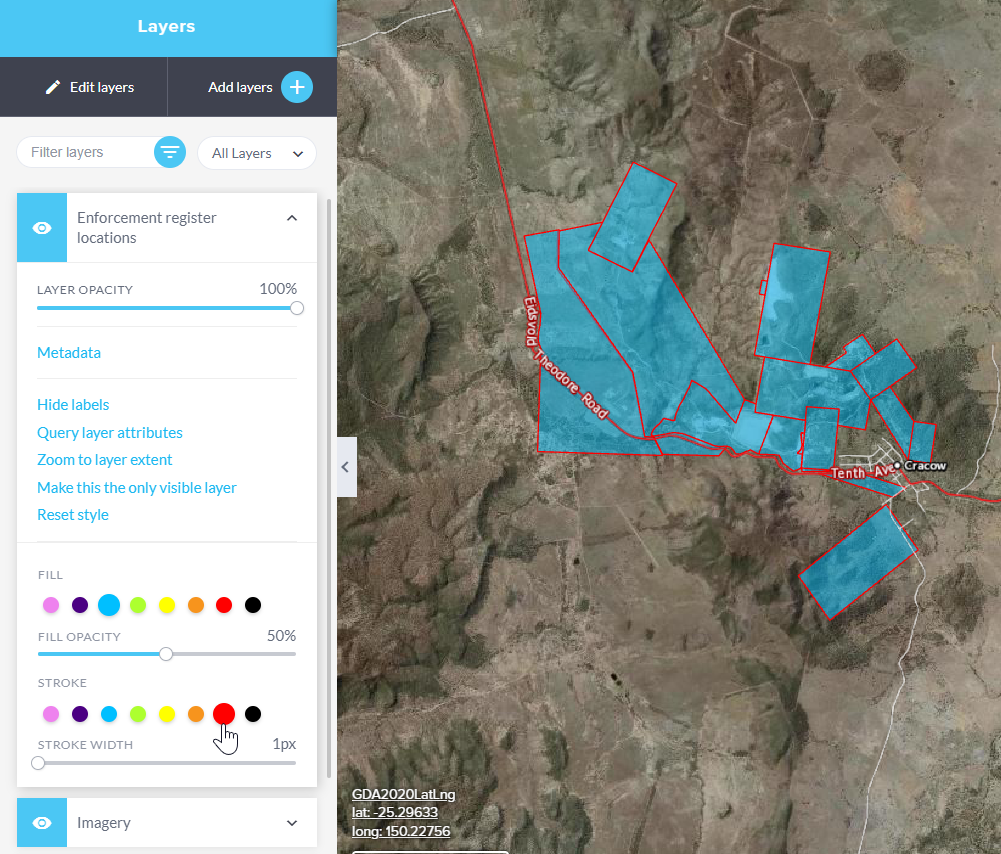
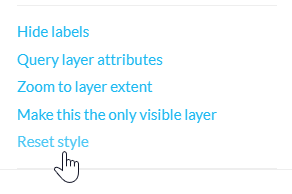
- Select Reset style if you wish to revert the symbology back to the default settings.
Sort user data layer
When user data files are added, the order of these layers can be altered within the Layers panel using the Sort user data layer option. Adjusting the order of the layers will be reflected on the map.
- This option will only appear after Edit layers has been selected.
- This tool is supported for user added files only.
- Configured layers added via the Add layers or via a Topic cannot be re-arranged.
- User-added data will always appear at the top of the Layers panel.
- This feature is available on touch screen devices, but is not a supported on mobile.
To re-order layers that have been added from user-added files:
- Add the user-added data files to the map.
- Select Edit layers

- Select Sort user data layer

- When this option is selected, it will only display the layers that can be re-ordered in the Layer panel. Drag and drop the layers into the required order.
- Select Done to accept the changes.
- Alternatively, you can select Done for editing the layers and the changes will be applied.

- In this example the layer containing the line feature was moved above all others. You will notice that this will affect the display order on the map.

Layers for 2D & 3D features
When user-added data files contain a mixture of 2D and 3D features, the application now separates them into different layers. These layers are categorized based on the feature type and whether the layer contains 2D or 3D features. To distinguish between these layers, a prefix is added to the layer name, indicating the feature type. If a layer contains 3D features, the prefix may include 3D.
The elevation mode dropdown menu for user-added data file layers is selectively displayed. It appears only for layers that contain 3D features.
How to view your land valuation
You can view of land value by:
- Add Topic
- Search
- Query layer attributes
- Access a SmartMap and Title search for a property
Adding the Land Valuations Topic
The land valuations layer and associated information can be easily added to the Queensland Globe is by launching the Land Valuations Topic:
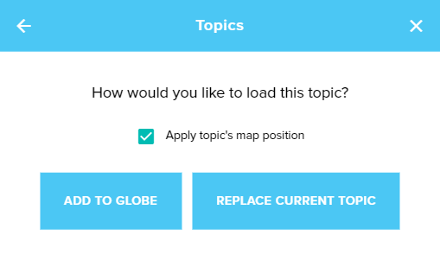
On the Queensland Globe left side menu bar, select Topics.

Select the launch button on the Land Valuations Topic.
Select either the 'Add to Globe' or 'Replace Current Topic' button.
Searching for a property
There are several ways to find the property you are interested in:
- Pan and zoom to it using the navigation tools
- Search for a property by address, lot/plan or its Property ID
- Select a property by its Property ID and highlight its boundary using a Layer Query. (This method is recommended for large multi-lot properties)
Search by address, lot/plan or Property ID
To conduct a search for a property by address, lot/plan or Property ID:
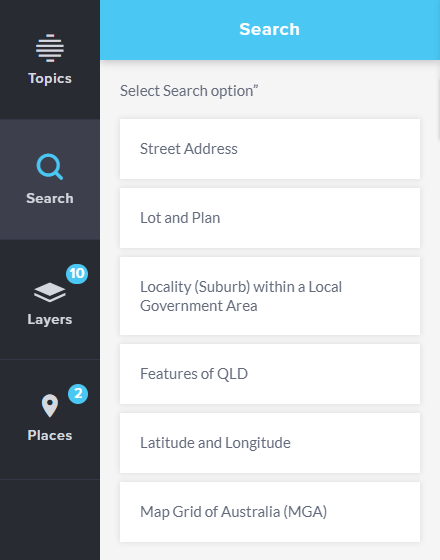
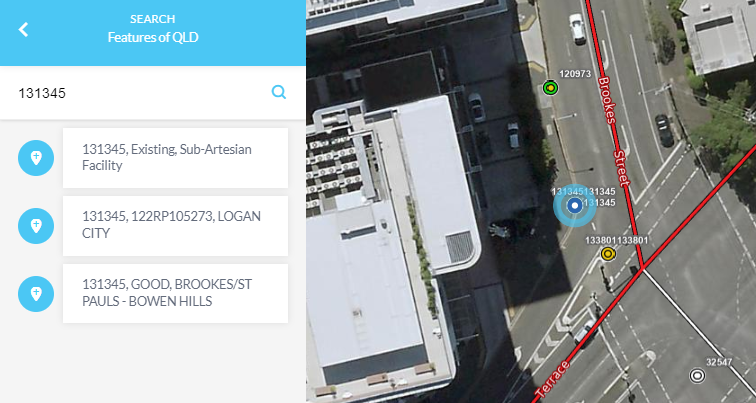
Select 'Search' on the menu.

Select your desired search method from the list of options. To search by Property ID select Features of QLD.
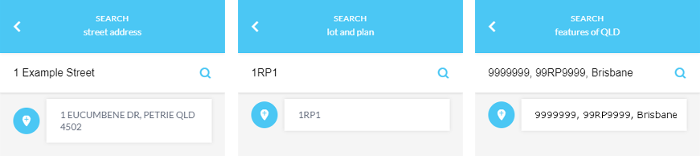
Type in the street address, lot and plan or Property ID of the place you are interested in, then hit enter or click the magnifying glass, then select the desired place from the results.
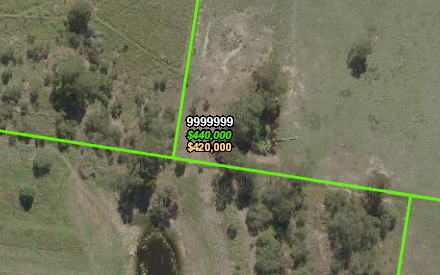
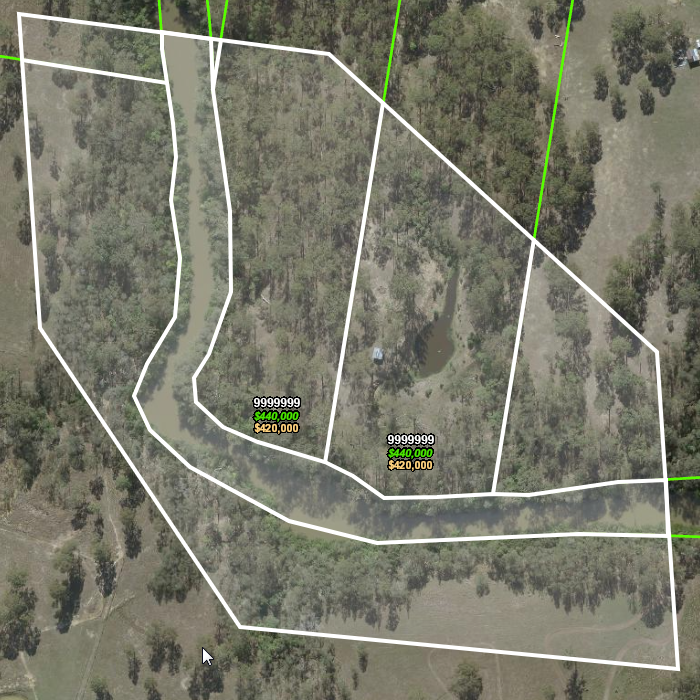
The place will now be identified on the main Queensland Globe window. Zoom in to the property to see more information such as:
- White label - Property ID number
- Green label - new valuation (visible during revaluation period)
- Gold label - current valuation
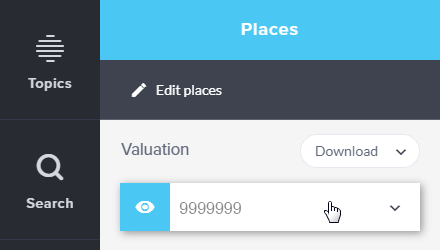
Searching by querying the attributes of a layer
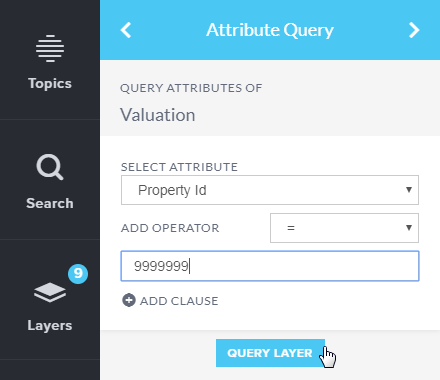
To select a property by its Property ID and highlight the property boundary on the map using the Query by Attributes functionality:
Select Layers on the menu
Find the Valuation layer and click on the down arrow beside the layer name to expose more functions
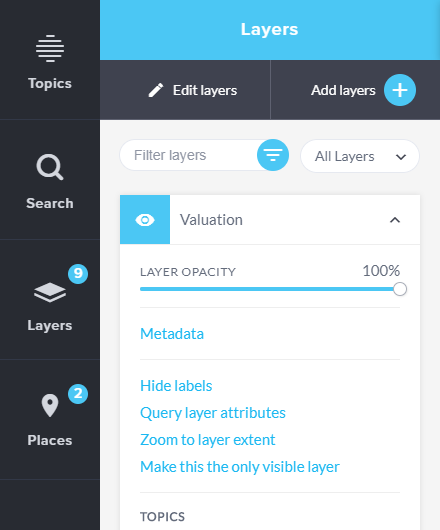
Select Query Layer Attributes and set up a query to select your Property ID, then press Query Layer
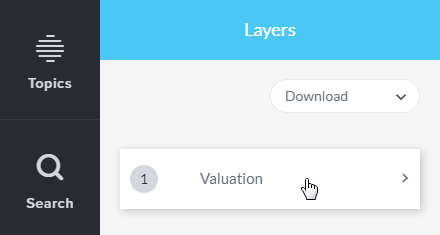
Click on the result to reveal the selected property record
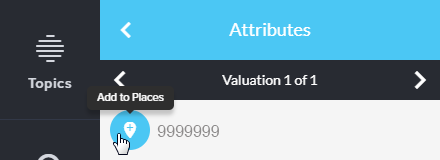
Click on the Add to Places button to highlight the property on the map
Select Places on the menu
Click on the Property ID record to zoom to the highlighted property on the map
Access a SmartMap and Title search for a property
You may wish to access SmartMap to obtain current information on property boundaries, valuations and sales data, and survey information.
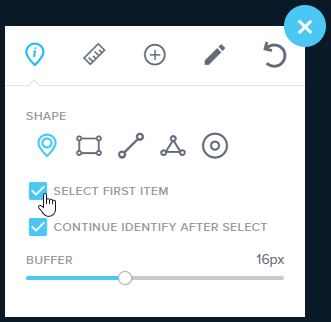
To do this click on the blue and white toolbox icon in the top right hand corner.

Here you will find the Identify tool click on this expand to view more identify options.
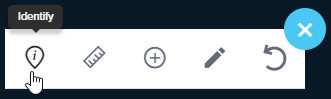
Ticking the Continue identify after selectenables you to click on additional features on the map without needing to re-select the identify tool each time.
If the Select First Item is checked, the attributes of the first feature selected will be displayed, rather than displaying layers, features and then attributes. Each feature's attributes can then by scrolled through.
To expand or reduce the radius of selections underneath your ouse pointer increase the buffer size. Drag the buffer bar to the right to increase and left to decrease.
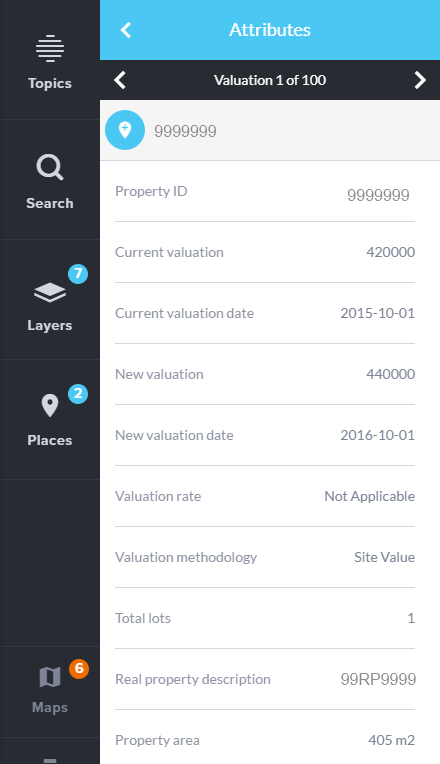
Then click on your point of interest on the map to see their specific details.
You'll notice a layer panel opens to the left of the screen - click on the name of the place you want details for.
This will display the Attributes menu for the location selected.
You may need to use the Left and Right arrows at the top of the menu to toggle through the Attributes panels to get to your property valuation information.
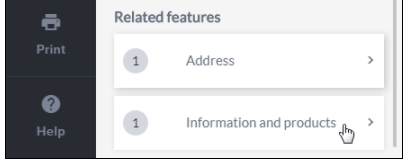
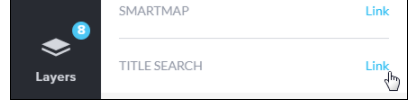
Scroll down and then select Information and products, select the links to view a SmartMap or perform a Title Search.
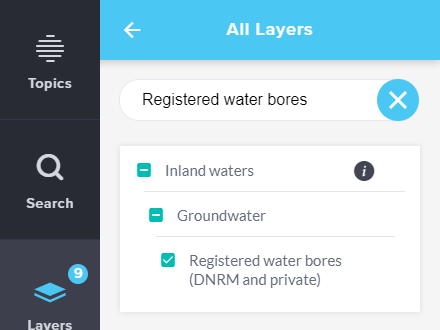
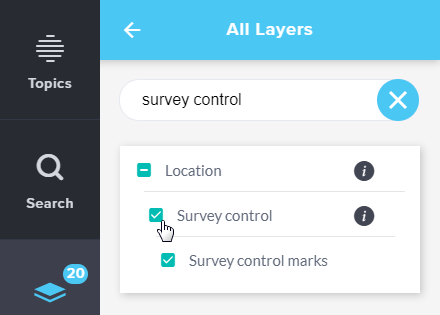
Getting a registered water bore report or a survey control mark report
To create a registered water bores or a survey control mark report, ensure the Registered Water Bores and Survey Control Mark group layer are added to your map and turned on.
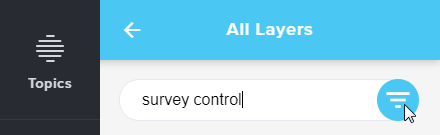
To do this, Click Layers and then Add layers button.

Click Add layers

Filter by 'Registered water bores', or 'Survey control marks' then hit enter or click the blue filter icon.
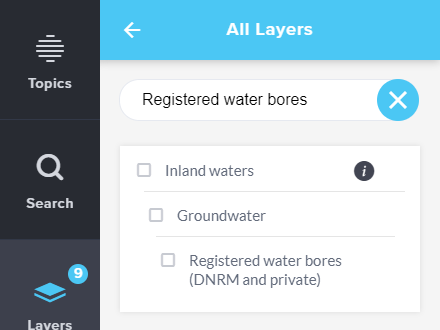
Turn on either the 'Registered water bores (DNRME and private)' or the Survey Control layer.
Zoom to your area of interest or search to the required location.
Then select the identify tool from the toolbar and click the Select first item checkbox.

Click on the desired bore or on a survey control mark on the map.
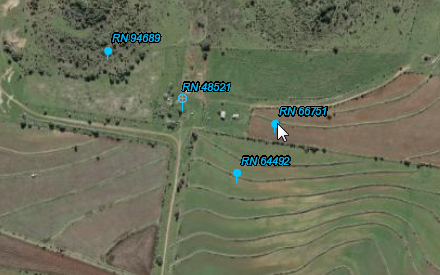
The Attributes panel will display. Select the Bore report link at the bottom of the Registered water bores Attributes panel or the Report link near the top of the Survey control mark Attributes panel
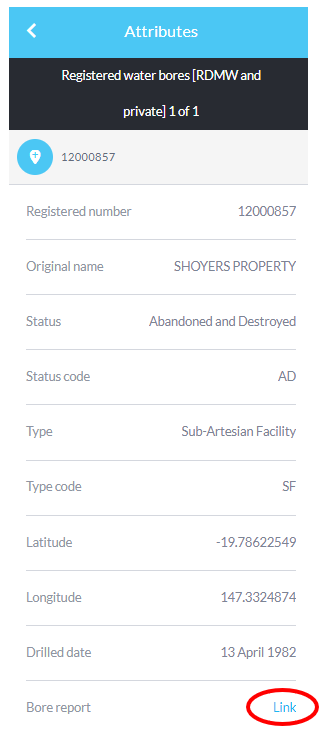
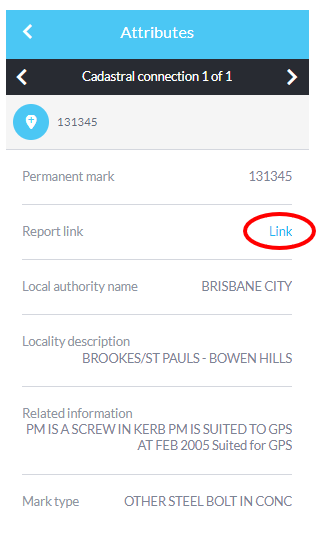
Please note: You may need to use the forward and back arrows in the black section of the Attributes panel toggle to the relevant information